TL;DR: Free up disk space on the partition that your browser uses for disk cache.
I encountered a strange issue with Chronograf today. The "Explore" tab began showing the message "The data returned from the query can't be visualized with this graph type" for a Flux query that was perfectly fine just a few hours ago.

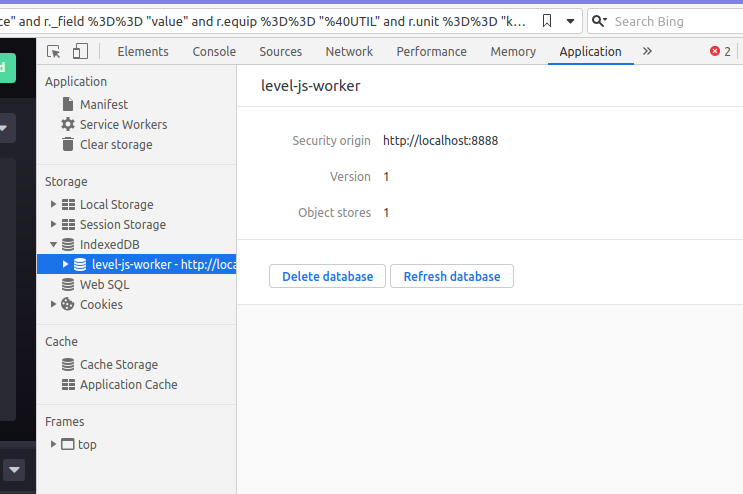
The browser console showed a "WriteError" related to LevelJS about exceeding some kind of quota, so I thought maybe a browser update had brought in some changes in storage caps. So I cleared all storage and deleted the IndexedDB database, and for safe measure cleared all browser cache. And it worked....for a while. A few hours later, it was back.


On the server-side, I could see an HTTP request from Chronograf to Influx failing (due to credentials?) in the logs, so I thought maybe the issue is with Chronograf not being able to update the telegraf db or something. So I restarted the Influx service and checked again. Didn't help.
"POST /api/v2/query HTTP/1.1" 401 55 "-" "Go-http-client/1.1"
Strange part was the Chronograf was able to display information about Influx just fine in the "InfluxDB Admin" section - I could add users, see queries, etc. But the "Host List" page was stuck spinning and the "Explore" and "Dashboards" were erroring out.
Solution
The issue was that although I had some 900MB+ free disk space on my SSD, the browser decides to cap space available to sites to a % of your free disk space. Apparently that wasn't enough for Chronograf to operate with, causing the sneaky error. Two things made it hard to figure out: (1) the error wasn't friendly (2) I work with large Excel files that I download and later delete, which caused the error to "toggle".